Logs
Overview
On this tab, you can view the log files which are generated after workflows are executed.
The Logs tab
Before you begin
From your Platform instance, navigate to Logs.
Make sure you have permission to view and interact with this page.
Features
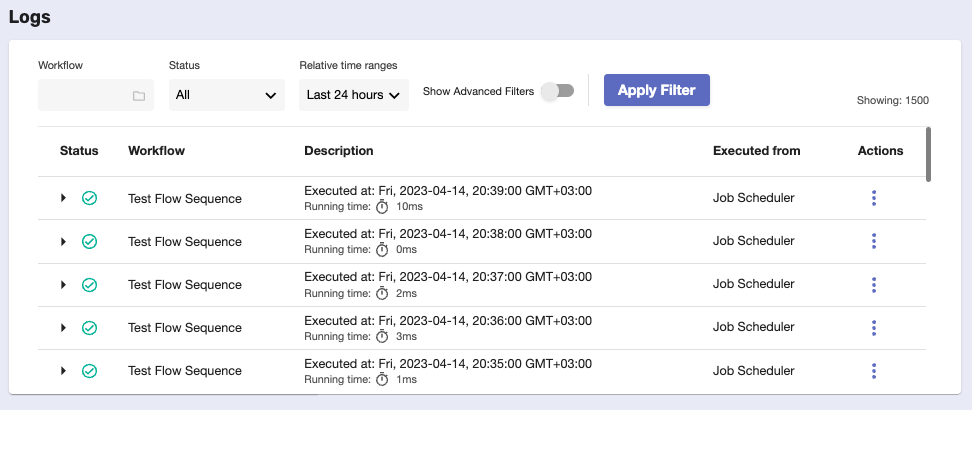
You can view and interact with the logs of previously executed workflows.
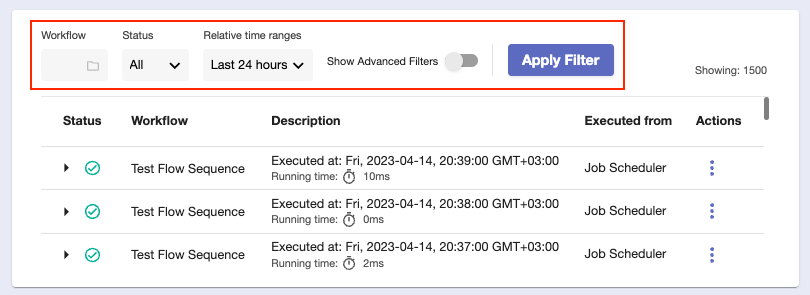
At the top of the page, there are several fields allowing you to filter what you see.
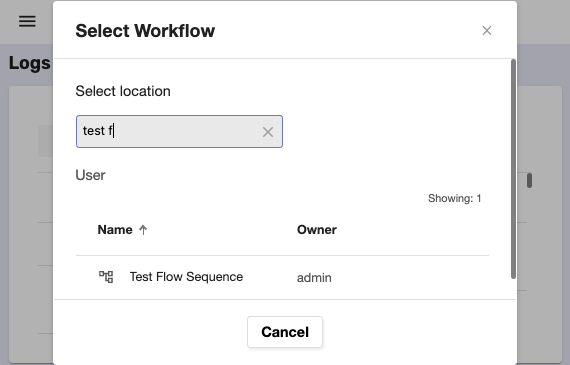
Workflow - through here, you can choose only one workflow for which log results will be shown.
Click the folder button to open a separate window where you can browse and select that flow.
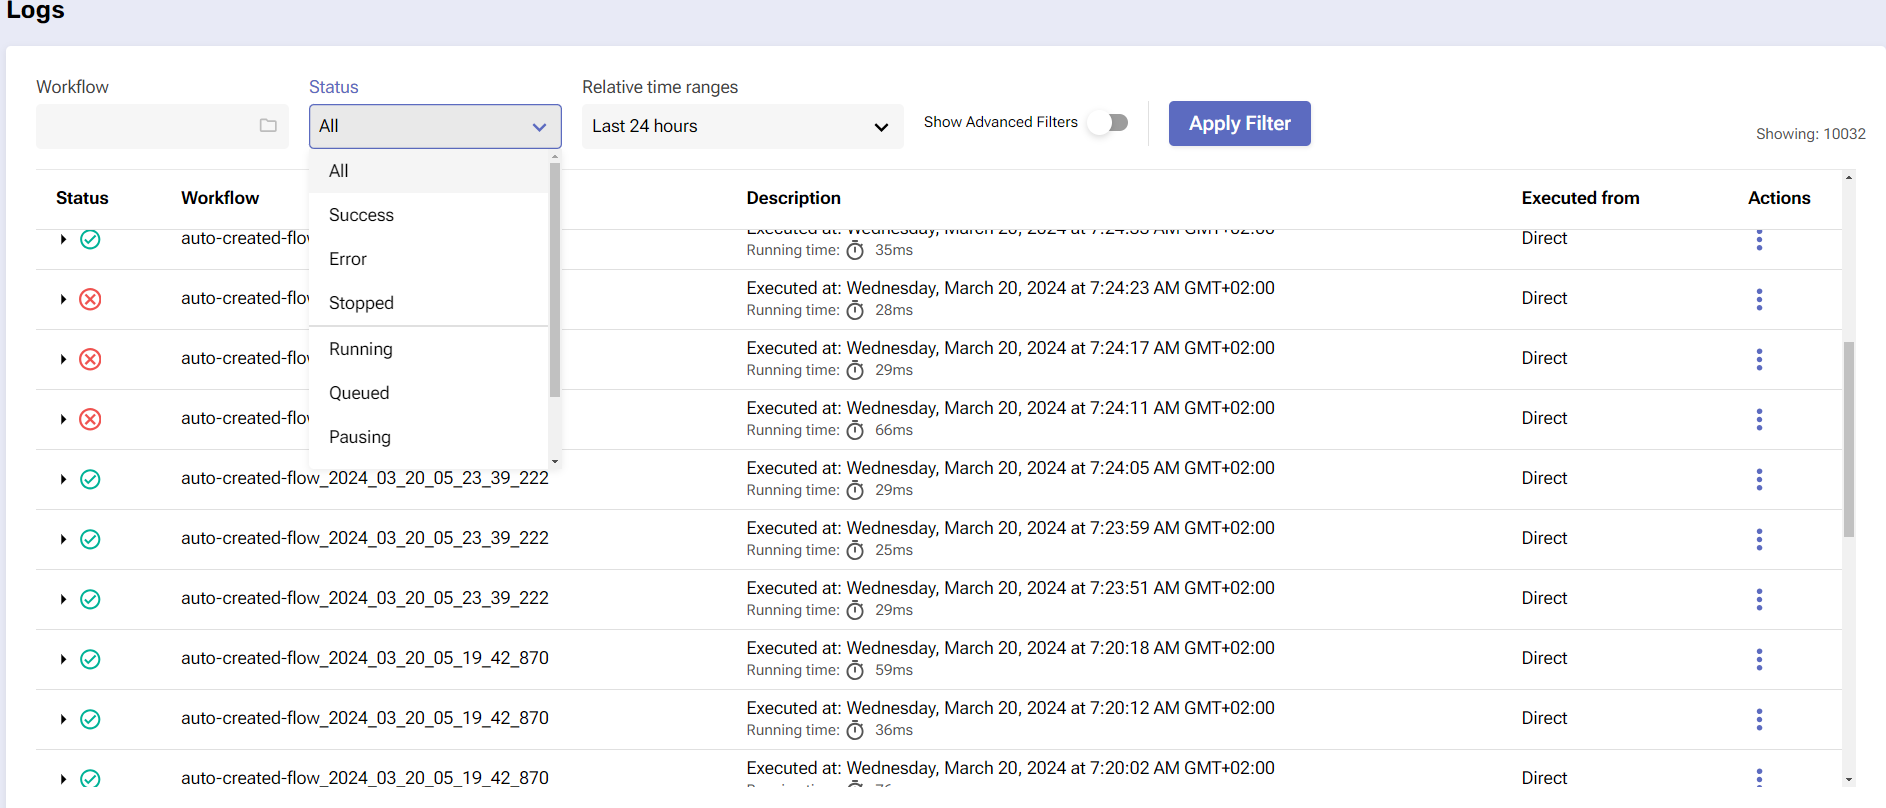
Status - this filter can list log entries based on whether they were produced. The available options are All, Success, Error, Stopped, Running, Queued, Pausing, Paused, and Stopping.
Relative time ranges - here, you can use a fixed time range according to which log entries will be listed. Options vary from “last 5 minutes” to “last 7 days”.

If you’re dealing with hundreds and thousands of logs, you can further control what you see by using one of the advanced filters.
Click the Show Advanced Filters slider and four more fields will pop-up.
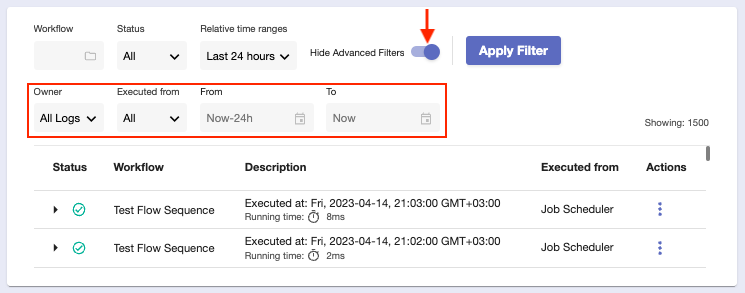
Owner - this filter can display all logs, or only the ones generated from scheduled workflows.
Executed from - here, you can specify the location from which the workflow has been executed and its subsequent log generated.
a) Direct - Workflow has been executed in the standard way, directly through the Workflow Editor or the Workflows page.
b) Job Scheduler - Workflow has been scheduled to execute as a job, or only at strictly defined time intervals.
c) API Gateway - Workflow has been deployed using the API Gateway system.
d) Automation Center - Workflow has been manually executed through the Automation Center.
From and To - similar to the relative time ranges, these fields allow you to see only logs which respect a certain fixed period.
Both of them are set with the help of an integrated calendar where it’s possible to choose dates and specific hours and minutes.
Only logs generated in this period will appear.

Keep in mind that relative time ranges cannot be used with From and To fields. When they’re set, the Relative time ranges field assumes a “Custom range” value.
If left blank, the From and To fields assume null values.
Don’t forget to click the Apply Filter button to reflect your settings.

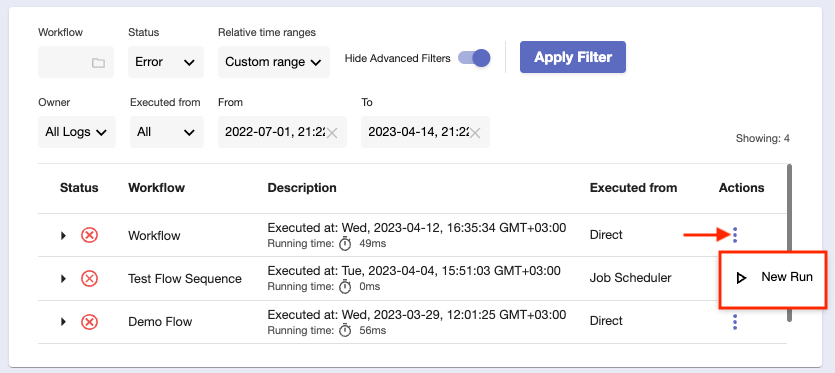
Logs actions
The only action you can perform on a log is to run its associated workflow again.
Click the three-dot button located in the Actions column and select New Run. A separate log entry will be generated shortly.
To get a look at the technical details of a log, click anywhere on its row to expand it.

Whether successful or not, logs contain the following information:
URI
Path of the workflow. You have the option to copy it with the folder button.
Executed by
Тhe name of the user who executed the workflow.
Worker Group
The worker group used in executing the flow.
Time started
Тhe exact time (in GMT) the workflow execution started.
Time ended
Тhe exact time (in GMT) the workflow execution ended.
Log
A unique log hash that can be referenced in Pliant or another logging platform. The icon on the right allows you to instantly copy this information.
Executed From URI:
Path of the location from which the workflow was executed.
Formatted and Raw
These tabs provide two different ways of viewing and reading the log. You can copy the contents of each tab with the icon on the right.

In addition, each log entry comes with three buttons executing different operations:
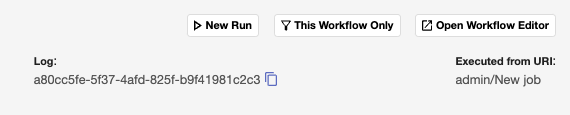
New Run
Clicking this button triggers an execution of the same workflow for which the current log entry was generated. A separate log will be produced shortly.
This Workflow Only
This button automatically filters the list of logs so that it shows only logs generated for the specific workflow.
Open Workflow Editor
Using this button, you can open the contents of the workflow for which the current log was generated (in either Flat or Flow mode).