ROI
Overview
Here, you’ll find various detailed reports about workflow executions. There are also statistics and MET calculations that contribute to ROI by simplifying its reports.
Before you begin
To access ROI, click Dashboard and then ROI.
Check what kind of permissions you have. Only administrators can see reports for all users' workflows.
Features
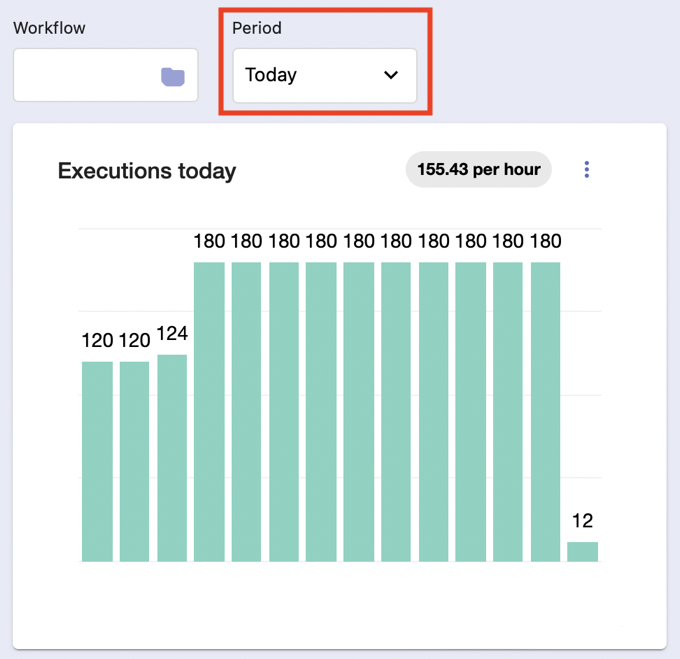
On the top, you can use a time selector drop-down to define the time range covered by the report.
By default, it’s set to Today, meaning that you won’t see calculations for any day other than the current one.
There’s also a flow selector field where you can choose a specific workflow to base the reports on.

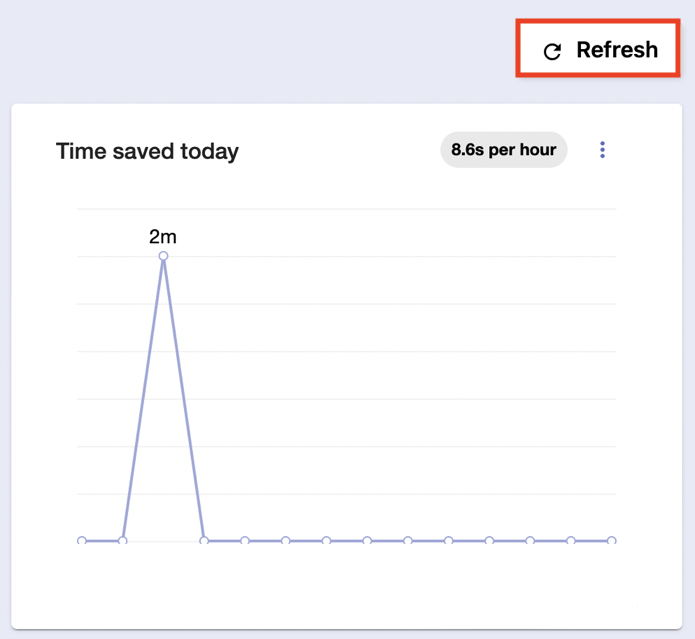
At the top-right corner, you can use a Refresh button to update the provided information.
You can find the following statistics:
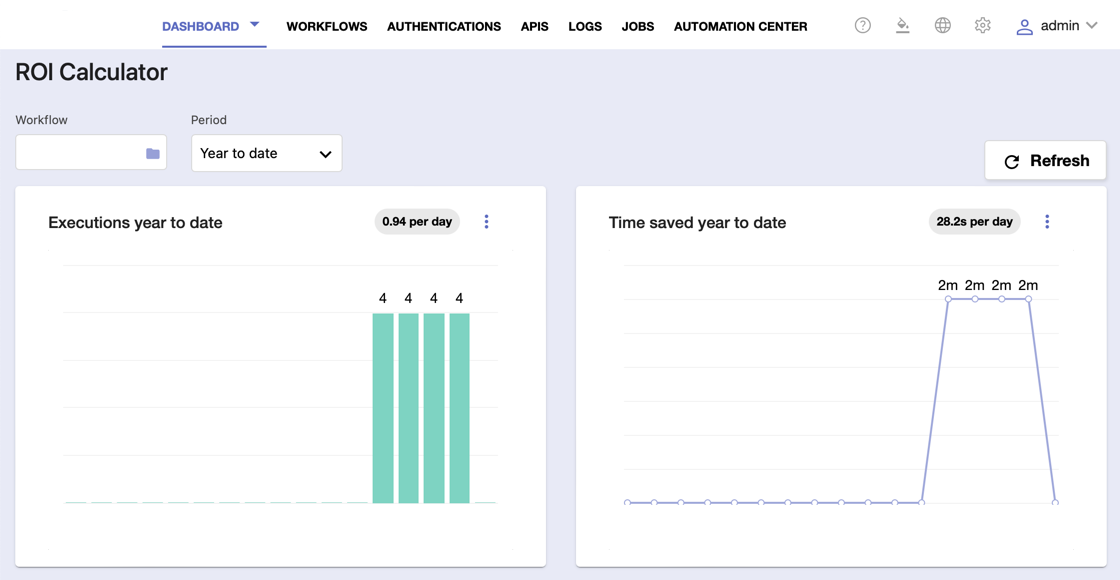
a. Number of flows that have executed in a selected time period.
The graph includes an average calculation and is split into bars representing the hours of the day, days of the week, or days of the month.

b. Time saved in a selected period.
This graph also includes an average calculation and divides the selected period into individual time windows.

c. Total workflow executions, total time saved and average time saved per flow based on the selected time period.

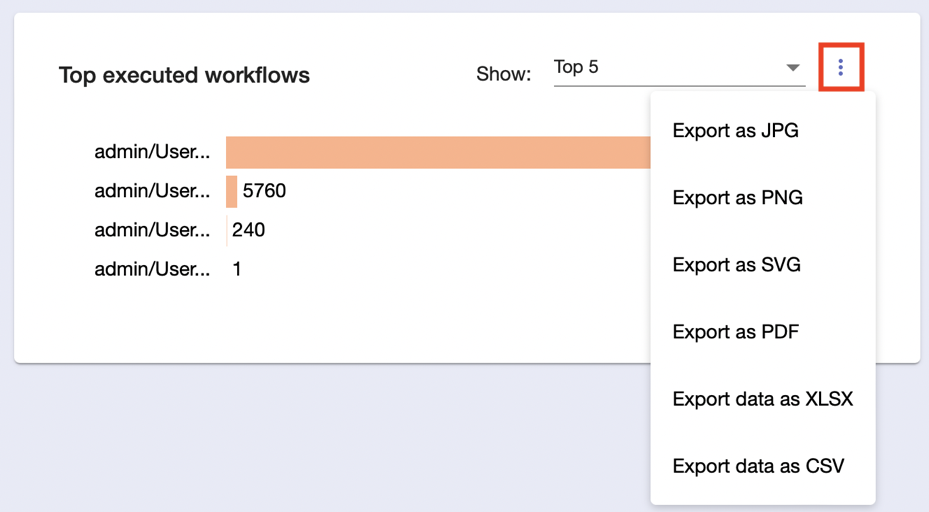
d. Top time-saved, executed, and failed flows in a selected time period, the number of which can be sorted by 5, 10, 15, or 20.

You can export each of these rankings in different file formats by clicking the three-dot button.