Troubleshooting Process
A comprehensive list of things to check when trying to figure out if a Pliant instance might be unhealthy, starting from the ground up. If you find anything that is not as it should be, contact Pliant Support
Host(s)
This section is only applicable if you are hosting your own Pliant instance on your own infrastructure
Network Connectivity
Is there connectivity to the Pliant host(s) via the following methods?
ICMP ping(if permitted)
# Example commands
ping 172.27.13.4
ping mypliant.pliant.io
SSH
# Example commands
ssh -i private_ssh_key.pem myuser@mypliant.pliant.io
ssh myuser@172.27.13.4
https://<instance-ip>
https://<instance-hostname>
Can you reach your intended target from the Pliant host? (ping, wget, etc)
If this is a multi-node cluster, can each node reach each other node?
Can nodes reach the Internet (if not a purposefully air-gapped environment)?
Memory Usage - top
Is total memory on each node 16GB or greater?
Is there 0 Swap used?
Is there more than 1GB free?
Disk Usage - df
Does df -h / show more than 10GB free on each node?
Are there any other disks to consider (is Pliant mounted on /pliant or another non-standard place)?
Do any non standard disks have <10GB free?
Kubernetes
This section is only applicable if you are hosting your own Pliant instance on your own infrastructure
Check nodes - kubectl get nodes -o wide
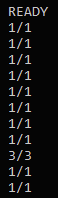
Are they all “Ready”?

Check pods – kubectl get pods
Are all pods running?

Are all pods showing all containers as ready? (2/2,1/1 etc)
Check storage for StatefulSet Persistent Volumes, make sure no more than 80% utilized
kubectl exec mysqldb-0 -- df -h /var/lib/mysqlkubectl exec object-storage-0 -- df -h /datakubectl exec pliant-stats-0 -- df -h /var/lib/influxdb
Getting application and container information
Pods
kubectl get pods -o widekubectl describe pod <pod name>kubectl logs <pod name>
Services
kubectl get services -o widekubectl describe service <service name>
Deployments
kubectl get deployments -o widekubectl describe deployment <deployment name>
Pliant
Can you log in to Pliant?
Check the workers (admin level login required)
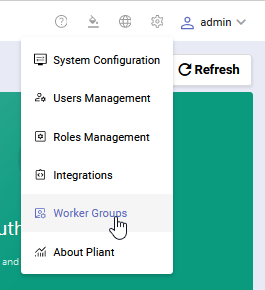

Does each worker group have the expected number of active workers (default typically has 2)?
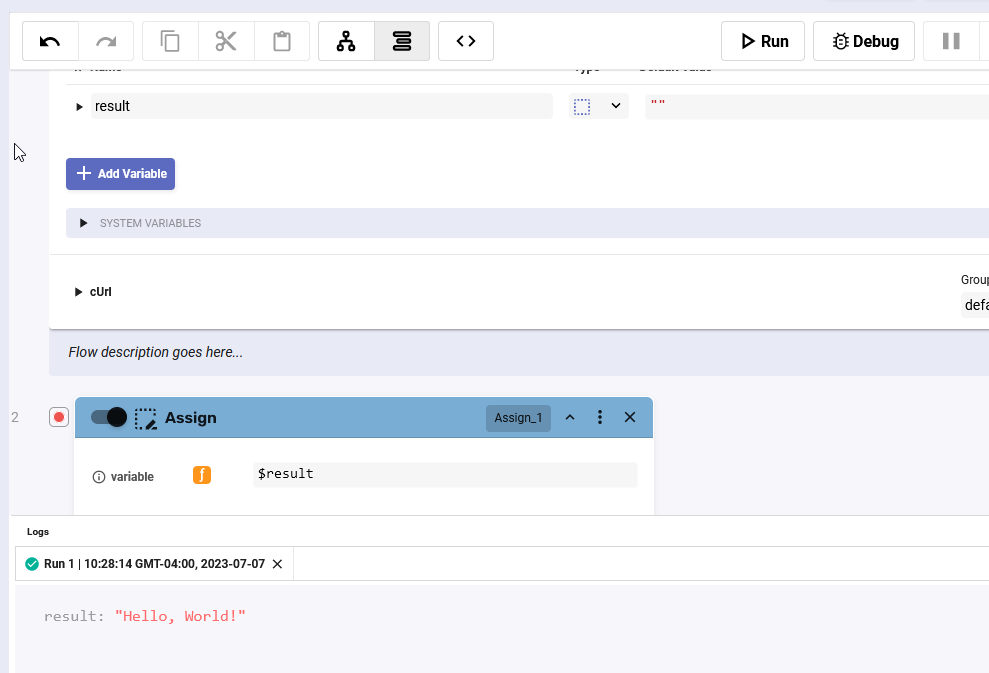
Does each worker have a recent heartbeat?Run a test flow. Does it run successfully?
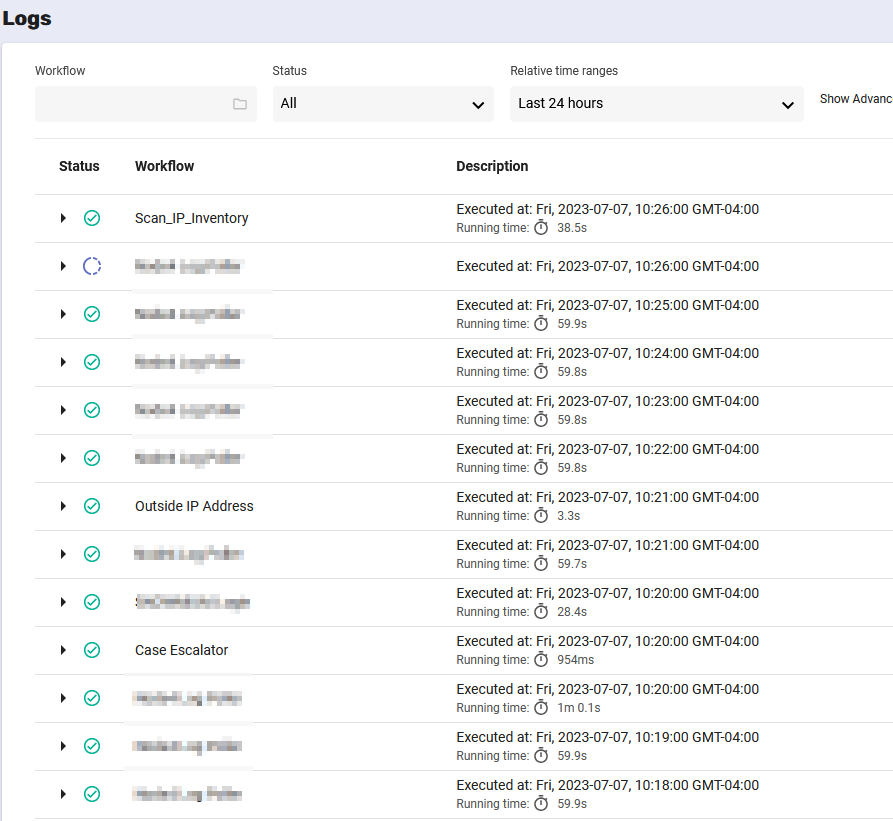
Check the Logs. Are any flow completing with errors?