Self Service Lab - Debugger
Overview
The purpose of this lab is to provide an example workflow already configured with breakpoints that illustrates the use of the Pliant Workflow Debugger in an interactive environment.
The Debugger
Launch Lab: Click here to get a lab login where you can explore the sample flows
A. Debugging a Workflow
A1. Navigate to the "WORKFLOWS" tab
A2. Go into the Debugger_Lab folder

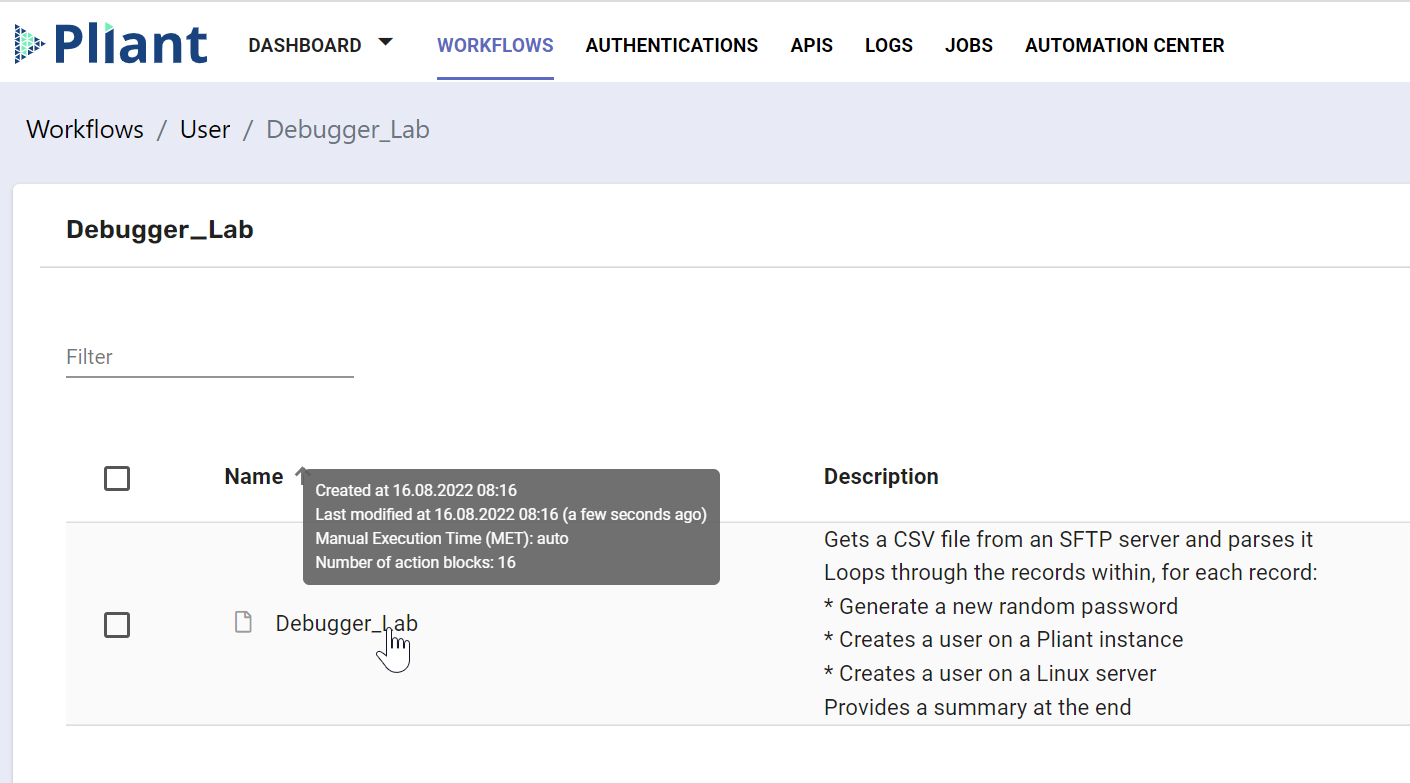
A3. Click on the Debugger_Lab flow
A4. Scroll down through the flow and note the red dots to the left of a few blocks. These are the breakpoints. When the flow runs in Debug mode, it will stop at each breakpoint and show the state of each variable and the output of each block in the Debugger pane of the Workflow Editor. This will be the state of the flow before it executes the block with the breakpoint.

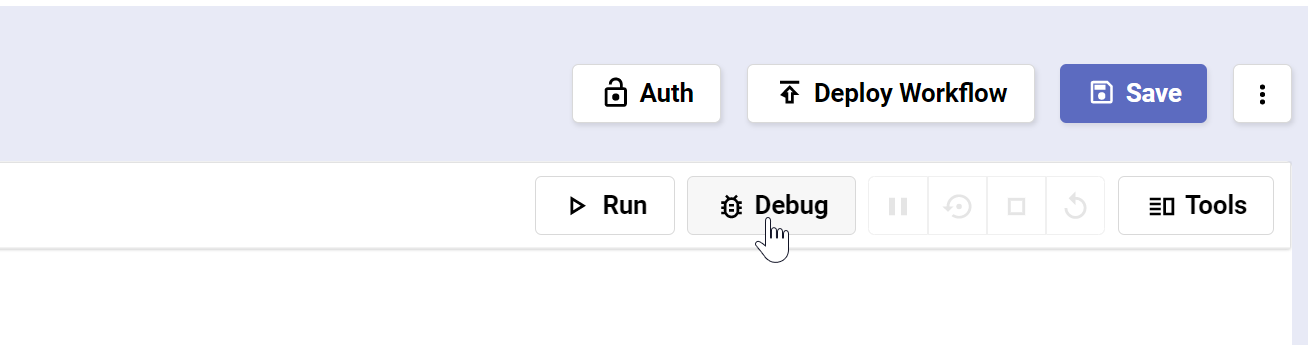
A5. Click the Debug button in the top right of the Workflow Editor
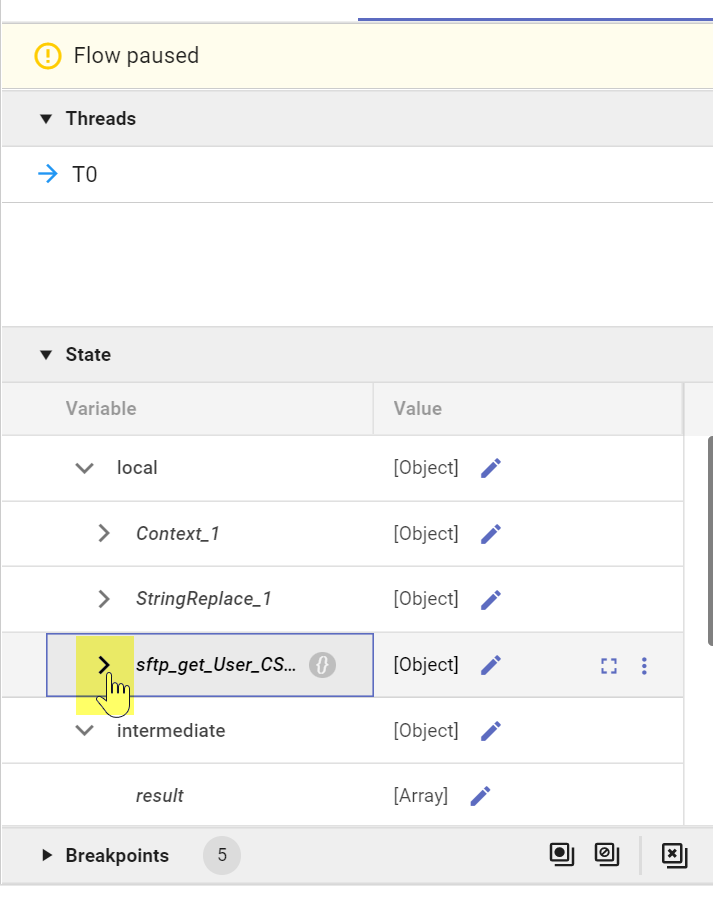
A6. The Debugger pane will appear

A7. Click the chevron next to the “sftp_get_User_CSV_File” section under the local heading. You will see the output from this block.

A8. Click the Step button to advance one block forward (regardless of breakpoint)

A9. Click the Resume button to advance to the next breakpoint
